Subtotal ₹0.00
Subscribe to out newsletter today to receive latest news administrate cost effective for tactical data.
Let’s Stay In Touch


Subscribe to out newsletter today to receive latest news administrate cost effective for tactical data.
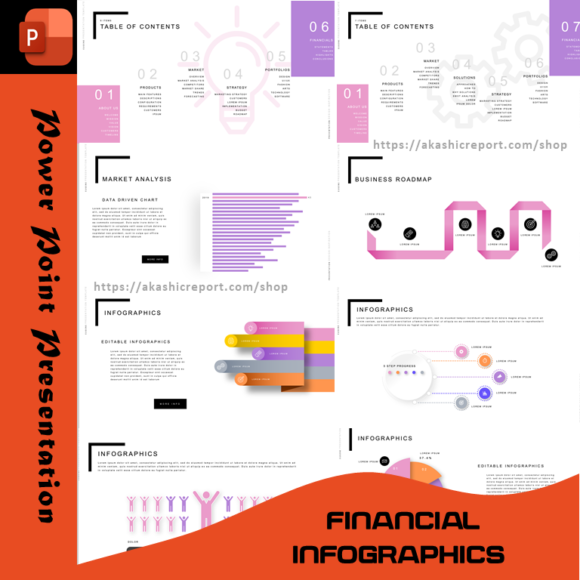
💼 FinGraph: The Ultimate Financial Infographics PowerPoint Template 💼
Elevate your financial presentations with FinGraph, a professional PowerPoint template designed to simplify complex data and make your reports visually compelling. With 35 fully customizable slides, this template is perfect for financial analysts, business consultants, marketers, and corporate professionals looking to deliver impactful presentations.
📊 Dynamic Infographics & Data Visualizations: Includes bar charts, pie graphs, percentage breakdowns, SWOT analysis templates, and data-driven charts to help you present financial information clearly.
🎨 Fully Editable Slides: Customize colors, fonts, and layouts to match your brand identity and presentation style.
📈 Versatile Layouts: Use the template for financial reports, market analysis, SWOT analysis, business proposals, company profiles, and more.
💼 Professional Aesthetics: Clean, modern designs ensure your data is presented in a visually appealing and easy-to-understand format.
🚀 Ideal for Business & Financial Professionals: Whether you’re an analyst, consultant, or executive, FinGraph offers the tools you need to create stunning presentations.
With FinGraph, your presentations will not only inform but also inspire confidence. Whether you’re presenting a quarterly report, pitching to investors, or sharing market insights, this template ensures your message is clear, professional, and engaging.
📥 Download FinGraph today and transform your financial presentations into stunning visual stories!
Availability: In Stock
FinGraph: Financial Infographics PowerPoint Template is a premium solution for professionals who need to present complex financial data in a visually compelling and easy-to-understand format. With 35 fully customizable slides, this template includes modern infographics, data-driven charts, tables, and SWOT analysis layouts. Ideal for financial reports, market analysis, business proposals, and corporate presentations, FinGraph helps you transform numbers into engaging visual stories that captivate your audience.