Subtotal ₹0.00
Subscribe to out newsletter today to receive latest news administrate cost effective for tactical data.
Let’s Stay In Touch


Subscribe to out newsletter today to receive latest news administrate cost effective for tactical data.
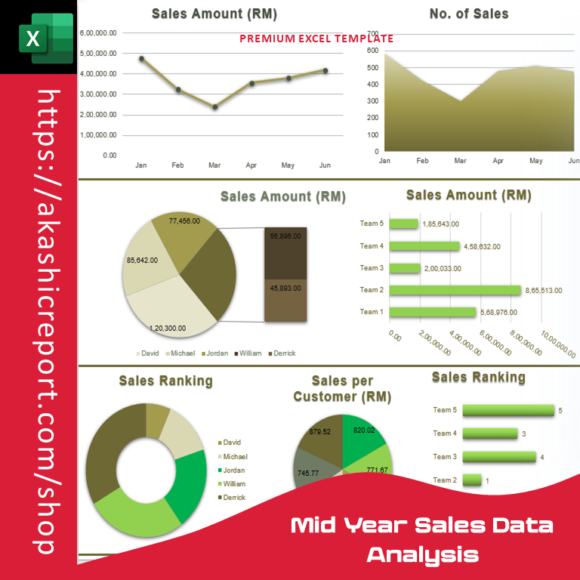
The Mid-Year Sales Data Analysis Excel Template is an essential tool for businesses aiming to assess and optimize their sales performance halfway through the year. Designed for managers, sales teams, and business owners, this template provides a clear and structured way to review your sales data and refine your strategy for the months ahead.
Key features include:
By using this template, you’ll gain a deeper understanding of your sales performance, enabling you to make data-driven decisions and adjust your approach to meet your annual goals. Streamline your mid-year analysis and ensure a successful second half with this practical and versatile tool.
Availability: In Stock
Analyze your sales performance with precision using our Mid-Year Sales Data Analysis Excel Template. This powerful and easy-to-use template allows you to evaluate your sales results for the first half of the year. Gain insights into trends, identify strengths and weaknesses, and optimize your strategies for the remainder of the year. Equipped with dynamic charts, tables, and built-in calculations, this template is your go-to tool for mid-year sales analysis.