Subtotal ₹0.00
Subscribe to out newsletter today to receive latest news administrate cost effective for tactical data.
Let’s Stay In Touch


Subscribe to out newsletter today to receive latest news administrate cost effective for tactical data.
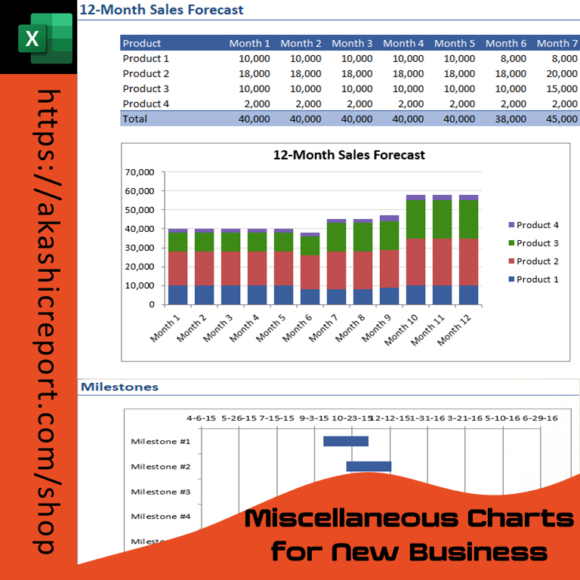
Launching and managing a new business requires clear insights and strategic decisions. Our Miscellaneous Charts for New Business Excel Template provides a ready-made solution to track business performance, analyze trends, and create visually appealing reports.
📊 Multiple Business Charts – Includes bar charts, pie charts, line graphs, area charts, and more to analyze various aspects of your business.
📈 Sales & Revenue Tracking – Monitor your monthly, quarterly, and yearly sales performance.
💰 Expense Breakdown & Profit Analysis – Visualize where your money is going and track profitability trends.
📅 Market & Customer Analysis – Understand customer demographics, sales by region, and product performance.
✏ Customizable & Easy to Use – Modify the charts, labels, and data inputs to suit your business needs.
📉 Real-Time Data Updates – Simply input your data, and the charts update automatically.
✔ Saves Time & Effort – No need to design charts from scratch; simply plug in your business data.
✔ Enhances Decision-Making – Gain visual clarity on business performance and adjust strategies accordingly.
✔ Perfect for Startups & Small Businesses – Ideal for entrepreneurs looking to track progress and impress stakeholders.
✔ Professional & Presentable – Use these charts for business reports, investor presentations, and financial planning.
With the Business Insights Chart Pack – Excel Edition, you can visualize your business growth, identify key trends, and make data-backed decisions for success.
📥 Download now and transform your business data into actionable insights! 🚀📊
Availability: In Stock
Miscellaneous Charts for New Business – Excel Template
Kickstart your business with data-driven insights! Our Miscellaneous Charts for New Business Excel Template provides a variety of pre-designed, customizable charts to help you analyze trends, track progress, and make informed decisions. Whether you need sales trends, revenue growth, expense breakdowns, or customer demographics, this template offers a visual representation of your key business metrics.